
AKO | From Leak Detection to Resolution
Case Study
How a leading US supermarket banner cut its refrigerant leak rate from the industry average to under 2% — with just 75 lbs of refrigerant added across a 24-location monitored estate.
At a Glance
The Challenge
The operator is a leading US supermarket banner with more than 200 locations.
Like most of US food retail, it faced a problem that has become a P&L and compliance issue: the average US supermarket loses about a quarter of its refrigerant charge yearly, prices are climbing, and EPA Section 608 and AIM Act obligations keep tightening.
Stores far from a service team were often managed by re-gassing leaking systems rather than fixing the source.
The goal was not an alarm. It was effectiveness: find leaks early, prioritize them by economic risk, repair them, and prove closure — consistently, across many sites, without adding headcount or burdening store IT.
The Deployment
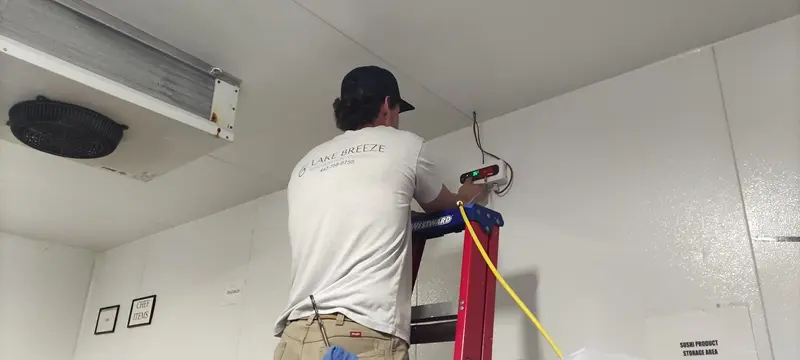
- Proof of concept (2024): a single refrigerant leak detector at one store validated the platform, cellular connectivity, and the monitoring workflow.
- First scaled phase (October 2025): full store-level coverage of 8–9 detectors per store at the leak-prone points that drive most refrigerant loss — motor rooms, walk-in coolers and freezers, and display cabinets.
- Expansion (March 2026): the monitored estate grew to 24 locations, with per-store density scaling from an initial ~4 detectors toward ~10 as coverage was optimized.
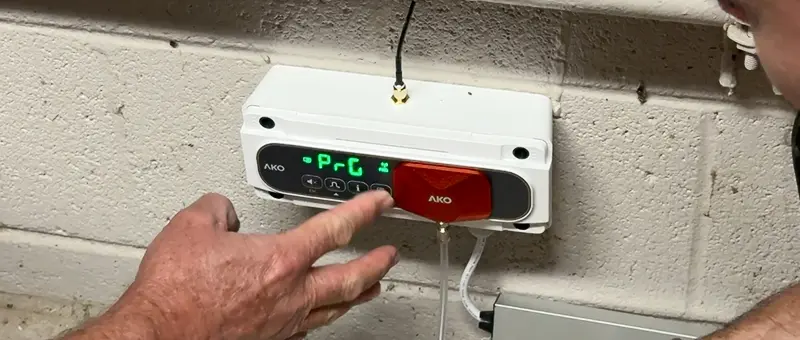
- Fleet: on the order of 137 AKO-575xxx detectors across 24 locations, each reporting via NB-IoT cellular directly to AKONET.Cloud — zero store-level IT integration. A further 15 Central-region stores with identified leak activity are designated for the next phase.
Because the program was scoped as a complete store-monitoring system rather than device-by-device, the fully installed cost landed at just over $2,000 per detection point — roughly the device price, with installation adding only a modest uplift.
Across ~137 points, that is on the order of $275,000–$280,000 in hardware and installation, plus the LDaaS managed-monitoring subscription.
Effectiveness: What the Numbers Show
That top row is the effectiveness argument in one line: the system was not quiet — gas alerts were detected, profiled, and worked at 19 of 24 locations.
Yet across all that leak activity, total refrigerant added since March 2026 was just 75 lbs, on ~55,000 lbs of installed charge, with only 2 locations requiring any gas.
Finding many leaks while adding almost no refrigerant is what early detection converted into early repair looks like.
The estate’s leak rate fell from roughly 11% (the GreenChill program average) to under 2%, beating GreenChill’s best-in-class (~6.5%).
Early detection has a physical, auditable definition here: systems operate with receiver liquid levels around 15%, and in the only two cases needing refrigerant, the leak was repaired before the level fell below 10% — no system ever approached critical charge loss.
The inflection: additions stop when monitoring starts
The chart below is the operator’s own service record, month by month.
Through September 2025, the estate absorbed roughly 590 lbs of replacement refrigerant every month, with no improving trend.
Monitoring went live in October 2025; from March 1 through July 8, 2026, the same locations required about 18 lbs per month — a 97% collapse beginning the exact month the detectors came online.
Nothing else about these stores changed.
Refrigerant additions collapse when monitoring starts — and stay near zero
2025 monthlies: HT service audit (Nov 2025 partial month omitted). 2026: AKO/HT monitoring — 75 lbs total since March across 24 locations.
Monthly refrigerant additions across the monitored locations — the collapse begins the month monitoring starts and holds near zero.
| METRIC | OUTCOME |
|---|---|
| Starting annual leak rate | ~11% (in line with the GreenChill industry average) |
| Resulting annual leak rate | Under 2% — better than GreenChill best-in-class (~6.5%) |
| Locations with gas alerts detected & worked | 19 of 24 |
| Total refrigerant added (Mar 1–Jul 8, 2026) | 75 lbs — only 2 of 24 locations required any |
| Receiver liquid levels (normal ~15%) | Never fell below 10% — both leaks repaired inside the safe band |
| Monitoring & field coordination | Governed by AKO’s Handshake closed-loop protocol |
Figures are drawn from the deployment as reported through AKONET.Cloud monitoring and field confirmation, March 1 – July 8, 2026, across the 24 monitored locations.
They describe the events managed under the deployment, not an unconditional guarantee for every system in perpetuity.
The control group: only the monitored locations improved
The strongest evidence is comparative. The rest of the operator’s fleet (~260 unmonitored stores, ~837,000 lbs of charge) is a natural control group from the same service records: for four straight years, it ran flat at 8–9%.
The monitored locations started as the fleet’s worst (13–16%, roughly double the average) and are the only group that moved, falling to a fraction of a percent once monitoring took hold.
The fleet did not improve on its own, and the program did not pick easy stores; it took the hardest ones and made them the best.
Monitored sample vs. unmonitored fleet: only the sample improved
Tracking basis: lbs refrigerant added per year ÷ lbs installed system charge — same audit data for both groups
*2025 = transition year, annualized (rollout began Oct 2025). *2026 = Mar 1–Jul 8 annualized: 75 lbs added, 24 stores — ~5× better than the <2% target.
2026 population (control) bar pending HT fleet report (5.5-month extract).
Monitored locations vs. the unmonitored fleet, same service records: the control group never moved; the monitored group (previously the fleet’s worst) fell below the public <2% claim.
Installs vs. Alerts — the Anonymized Picture
Each cell is one monitored location (anonymized).
- Green = gas alert detected and worked during the period (19 of 24);
- Grey = no alert.
Refrigerant was required at only 2 of the 24 — both repaired inside the receiver’s safe operating band.
Store by store, every monitored location moved from its baseline (several previously running well above the EPA’s 20% action threshold) to under 2%.
Across the fleet, roughly 5,000 lbs of annual refrigerant loss was avoided, worth about $90,000 per year at $18/lb.
Three Events That Show the Model Working
Why It Worked
Coverage and cost, honestly compared
On a representative ~60,000 ft² store with ~5,700 ft² of cold/refrigerated area (where leaks occur) the distributed model covers about six times more of the cold area than a centralized aspirated system (e.g., MSA Bacharach Multi-Zone: one shared sensor sampling up to 16 zones through tubing), at a fraction of the cost per covered square foot:
| COVERAGE / COST BASIS | AKO DISTRIBUTED | BACHARACH MULTI-ZONE |
|---|---|---|
| Representative installed system price | ~$30,000 | ~$52,000 |
| Cold-area coverage (refrigerated zones monitored) | ~67% (~3,830 ft²) | ~11% (~610 ft²) |
| Cost per ft² of actually-covered area | ~$7.84/ft² | ~$85.67/ft² |
| Relative cost efficiency per covered ft² | ~11× lower | Baseline |
Basis: a representative ~60,000 ft² store with ~5,700 ft² of cold/refrigerated area; AKO covers ~3,830 ft² of it; the aspirated system covers ~610 ft². Figures vary with store geometry and sensor placement
The distributed system is also about $22,000 cheaper outright per store, with an independent sensor at every point — no single fault blinds a 16-zone set, and each device feeds the profiling picture.
A managed service, not just hardware
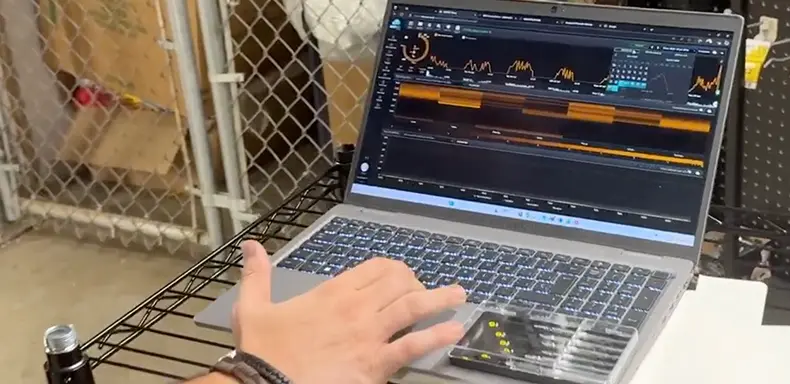
The detectors surface the signal; the LDaaS managed service turns it into a repaired, documented outcome: AKO’s monitoring team converts raw ppm into economic and emissions leak intelligence, issues a color-coded dispatch by economic risk, and the Handshake protocol governs closure — neither side closes a case without the other’s confirmation.
The Bottom Line
For hardware and installation on the order of a quarter-million dollars (plus a managed-service subscription) the operator took a 24-location portfolio from an industry-average ~11% leak rate to under 2%: alerts worked at 19 locations, 75 lbs added estate-wide, two locations needing any, and no system approaching critical charge loss — with zero store-level IT integration, across multiple states, on a phased timeline, and 15 more stores identified for the next phase.
Bacharach can tell you there is gas.
AKO found the leaks, prioritized them, repaired them, and verified closure — working on leaks at 19 of 24 locations while adding just 75 lbs of refrigerant across the entire estate.
To discuss a pilot or request a customized economic analysis for your estate, visit our refrigerant leak detection services or contact our leak detection experts.
Figures reflect an AKO deployment at a leading US supermarket banner as reported through AKONET.cloud and field confirmation: refrigerant prices, regulatory requirements, and specifications may change over time.