Executive Summary
ESG has moved from voluntary narratives to mandatory, investor-grade reporting.
In cold-chain sectors (retail, restaurants (QSR and full service), and grocery) refrigerants, energy, downtime, and workforce stability are no longer back-of-house issues; they’re non-financial KPIs that drive spend efficiency and ultimately shape the balance sheet.
California’s SB 253 / SB 261 and New York’s Part 494 / Part 253 pull these operations directly into regulated disclosures, alongside the SEC’s climate rules and the EU’s CSRD.
The operators that capture contemporaneous, auditable data will reduce costs, de-risk financing, and build durable brand trust; those that don’t will face penalties, higher capital costs, and reputational drag.

What is ESG Reporting?
At its core, ESG reporting is a structured way of demonstrating a company’s performance on sustainability and governance measures.
ESG reporting provides a data-driven framework for assessing a company’s performance on environmental, social, and governance factors.
A sustainability report is a comprehensive document that showcases a company’s environmental, social, and governance performance.
📌 Unlike traditional financial KPIs, such as revenue growth or margin, ESG relies on non-financial KPIs—how an organization uses energy, manages refrigerants, treats its employees, and oversees its supply chain.
For retail, restaurant, and grocery, these non-financial KPIs are no longer side projects. They include:
- Refrigerant emissions and leak rates (Scope 1)
- Electricity consumption and efficiency (Scope 2)
- Waste diversion, water usage, and recycling rates
- Labor practices, safety incidents, and diversity measures
These are examples of ESG indicators used in ESG reports.
These KPIs matter to operations because they reflect the daily realities of running a store, distribution center, or restaurant.
A leaking freezer isn’t just a maintenance problem—it’s an emissions KPI that must be reported under California SB 253 or New York Part 494.
High electricity bills reflect efficiency KPIs that influence SEC climate disclosures; workforce turnover is a social KPI tracked by investors and regulators.
Sources: JD Supra; Department of Environmental Conservation; DART
An ESG report provides stakeholders with a transparent view of a company’s sustainability efforts and progress toward corporate governance goals.
ESG reporting covers key topics such as human rights and business ethics, which are fundamental to responsible business practices.
Emissions and energy use reporting also includes carbon emissions and environmental impacts as critical metrics.
Tracking these KPIs helps companies identify and manage ESG risks.
Sustainability initiatives and sustainable practices are implemented to improve ESG performance.
Regulators and investors increasingly require ESG compliance.
ESG frameworks and ESG reporting standards provide the structure for these disclosures. Sustainability efforts are tracked and reported to demonstrate progress.
Sustainability reports have become a standard practice for providing consistent, comparable ESG information to stakeholders and regulators.
ESG metrics are used to evaluate a company’s performance and are often included in financial statements and annual reports.
🚨 Cold-chain performance is now public record.
ESG reporting often complements the information typically included in an annual report by providing additional detail on ESG goals, risks, and progress, whereas annual reports focus primarily on financial performance and governance. Integrated reporting ensures consistency by connecting ESG data across various reports.
External stakeholders, including investors and customers, rely on ESG disclosure for informed decision-making.
Many companies align their ESG reporting with the United Nations Global Compact, the Sustainable Development Goals, and guidance from organizations such as the World Economic Forum and the Accountability Institute.
Data security is a key governance issue in ESG reporting. ESG reporting supports sustainable investment by providing clear, comparable data.
An effective ESG report adheres to recognized standards and is often subject to third-party assurance, which may be included in audited financial statements.
ESG reporting frameworks are designed to be applicable across different business models. A strong ESG strategy and ongoing ESG efforts are essential for long-term success.

ESG Reporting Frameworks and Standards
An effective ESG reporting strategy starts with the right frameworks and standards.
The Global Reporting Initiative (GRI) is widely recognized for its comprehensive approach to sustainability reporting, offering detailed guidance on disclosing environmental, social, and governance (ESG) impacts across industries.
For companies seeking industry-specific metrics, the Sustainability Accounting Standards Board (SASB) provides tailored sustainability standards that help organizations report on ESG factors most relevant to their sector.
The Task Force on Climate-related Financial Disclosures (TCFD), established by the Financial Stability Board, provides recommendations for reporting climate-related risks and opportunities, enabling companies to align their disclosures with investor expectations and regulatory requirements.
As ESG reporting becomes more globalized, the International Sustainability Standards Board (ISSB) is working to create a unified set of sustainability reporting standards, aiming to harmonize ESG disclosures and ensure consistency across markets.
Many existing sustainability frameworks originated as voluntary standards, resulting in a patchwork of approaches; the ISSB seeks to replace these voluntary standards with globally harmonized requirements.
In the European Union, the Corporate Sustainability Reporting Directive (CSRD) mandates large companies to report on their ESG performance using the European Sustainability Reporting Standards (ESRS).
These evolving ESG reporting frameworks and standards (whether from the GRI, SASB, TCFD, or ISSB) are essential for producing high-quality, comparable ESG data that meets the needs of investors, regulators, and other stakeholders.
Adopting recognized sustainability standards not only supports compliance but also strengthens a company’s ESG performance and transparency.

Why Non-Financial KPIs Matter
The most pressing sustainability issues in retail, restaurants, and grocery rarely appear as neat balance-sheet line items.
Instead, they appear as non-financial KPIs (such as refrigerant leak rates, energy intensity, downtime hours, employee turnover, and maintenance frequency) that relentlessly shape operating costs and long-term performance.
These KPIs also help identify ESG risks that can impact the company’s performance.
Tracking these KPIs can also improve ESG scores, which investors use to evaluate companies.
Hidden in Plain Sight
Non-financial KPIs don’t appear directly on balance sheets, but they are embedded in everyday expenses:
- Payroll and contractors grow with overtime, burnout, and turnover.
- Maintenance costs rise as break-fix calls increase and assets age prematurely.
- Utilities climb when refrigeration and HVAC lose efficiency.
- COGS swells with food waste from downtime.
Operational Leading Indicators
These KPIs are leading indicators of cost and risk:
- A Los Angeles produce warehouse leak is both a reportable Scope 1 emission (SB 253) and a predictor of higher refrigerant spending.
- A New York freezer outage can drive waste KPIs (COGS) and trigger disclosure under Part 253’s climate-risk lens.
- Repeated after-hours service calls fuel technician burnout—now a social KPI investors watch.
From Costs to Strategy
📌 When tracked accurately, these KPIs become strategic assets: pinpointing efficiency opportunities, reducing turnover, creating auditable records for regulators, and strengthening disclosures with investors and lenders.
They serve as a barometer for performance on the balance sheet and profit and loss (P&L) statement.
We can assess the effectiveness of the company’s spending by tracking key KPIs listed as part of Scope 1 & 2 ESG reporting.
Where ESG Reporting and the Global Reporting Initiative are Used
ESG reporting has evolved from CSR to regulated disclosure, spanning state, federal, and EU regimes and drawing cold-chain operations into the center of compliance.
SEC Climate Disclosure (U.S.): Status as of Sept. 1, 2025
The SEC adopted climate-related disclosure rules on March 6, 2024, drawing heavily on TCFD (governance, strategy, risk, metrics/targets) and including certain items that would appear in or be referenced by audited financial statements.
On April 4, 2024, the Commission voluntarily stayed the rules pending review in the U.S. Court of Appeals for the Eighth Circuit.
On March 27, 2025, the SEC voted to withdraw its defense of the rules in court; the rules have not been rescinded, but they remain stayed pending the outcome of the litigation.
Bottom line: there are no operative federal compliance dates right now (the previously discussed “earliest applicability to LAFs for FY 2025” is not in effect while the stay remains).
Companies are still wise to maintain investor-grade processes (e.g., refrigerant/energy data, controls, assurance pathways) both for risk management and to meet state (e.g., CA/NY) or foreign (CSRD/ESRS) demands.
📌 This is informational, not legal advice. Monitor the Eighth Circuit docket and SEC updates for changes. Recent SEC and practitioner notes confirm the rules remain stayed, the Commission has ended its defense, and it has asked the court for further direction.
Source: Public Company Advisory Blog
CSRD (Europe)
The EU’s CSRD requires reporting under the ESRS standards with double materiality. The CSRD encourages integrated reporting, combining financial and sustainability information in a single sustainability report.
Timeline:
- FY 2024 for existing NFRD entities;
- FY 2025 for large EU companies;
- FY 2026 for listed SMEs (with opt-outs); and
- From FY 2028, non-EU companies with substantial EU activity
- Limited assurance moves toward reasonable assurance later in the decade.
Sources: Finance; Grant Thornton; Plan A
California: SB 253 and SB 261
SB 253 (Climate Corporate Data Accountability Act) — companies doing business in CA with >$1B annual revenue must disclose Scopes 1 & 2 (first reports due 2026 on 2025 data) and Scope 3 (2027 on 2026 data).
CARB to finalize implementing regs (rulemaking timeline tied to July 1, 2025 milestone). Assurance phases in. Refrigerant leaks (Scope 1) and electricity (Scope 2) are directly in scope.
SB 261 (Climate-Related Financial Risk)
Companies with >$500M revenue (insurers excluded) must publish biennial climate-risk reports (first due 2026) aligned with TCFD-style governance, strategy, risk management, and metrics/targets.
Cold-chain reliability, energy price exposure, and refrigerant compliance must be assessed as financial risks.
New York: Part 494 and Part 253
6 NYCRR Part 494 (Hydrofluorocarbon Standards & Reporting)
Adopted Jan 2025 by NYSDEC; expands registration, reporting (including stockpiles and leaks), leak detection, and end-of-life reclamation obligations for certain commercial refrigeration/HVAC systems and refrigerant wholesalers/distributors.
Effective dates phase in; enforcement via DEC. These regulations require companies to report greenhouse gas emissions associated with hydrofluorocarbon use as a key environmental metric.
Source: Department of Environmental Conservation; SiteCompli
6 NYCRR Part 253 (Mandatory GHG Reporting)
Proposed: Mar 2025 by NYSDEC; creates a statewide GHG reporting program (data collection + verification) for specified reporting entities (including certain “Large Emission Sources”).
First reports proposed due June 1, 2027 (2026 data); annual thereafter. Aligns methods with statewide inventory; supports forthcoming cap-and-invest. Reporting of greenhouse gas emissions is a central requirement under this regulation.
Sources: Department of Environmental Conservation; Latham & Watkins
C-Suite / Shareholders
For executives and investors, ESG reporting is now a strategy and risk management tool, not just PR. Refrigerant management, energy efficiency, and workforce stability are leading indicators of margin durability and operational resilience.
The board should expect facility-level KPIs (leak-rate trajectory, downtime minutes, kWh per cooler, overtime hours) with confidence levels and assurance plans—because these are the inputs behind emissions totals, risk narratives (SB 261/NY Part 253), and the company’s cost of capital.
Source: Stok

Credit Providers
Lenders are increasingly evaluating the data quality and controls behind ESG numbers. Auditable refrigerant records, verified energy data, and clear remediation playbooks lower perceived operational risk and can improve terms.
High leak rates, recurring outages, or weak verification elevate DSCR concerns and covenant risk—especially under California and New York regimes that surface these metrics publicly.
Source: JD Supra
ESG Data’s Role and the Sustainability Accounting Standards Board in the Future (Money-Efficiency Frame)
ESG data now shapes executive pay, financing, talent, and consumer trust; and, critically for operators, it’s becoming the way the efficiency of money spent is judged.
Executive compensation
Tying bonuses to leak reduction, energy intensity, food waste percentage, and workforce stability converts ESG intent into measurable cost control and asset life gains.
Financing
Precise, assured KPIs (lower leak rates, verified kWh reduction) are proxies for financial efficiency, supporting better spreads and covenants.
Talent
Lower overtime and incident rates cut churn costs and raise productivity.
Consumer loyalty
Waste reduction and fair work practices translate to lower COGS and stronger brand equity.
Balance-Sheet Link
Non-financial KPIs explain how effectively each dollar is spent.
Leaks → R&M and gas costs; energy intensity → utilities; turnover → recruiting/training; downtime → COGS and lost sales.
ESG data may not live on the balance sheet, but it’s the story behind it.
The Competitive Advantage
Done well, ESG becomes an advantage, not overhead:
- Lower financing costs
- Steadier operations
- Safer compliance posture
- Higher retention, and;
- More trusted brands.
Carbon Neutrality and Climate Goals
Refrigerants dominate many food-retail Scope 1 profiles: 1 lb of R-22 ≈ is equivalent to approximately 1,810 lbs CO₂e; a 30-lb cylinder is equivalent to the annual emissions of seven cars.
📌 Carbon-neutral plans that ignore leak prevention and proper end-of-life recovery are incomplete under CA and NY expectations.
Pair leak mitigation with energy efficiency, heat recovery, and renewable procurement to hit credible targets.
Source: Department of Environmental Conservation
Data Governance (Audit-Ready Box)
What auditors and lenders want to see:
Evidence sources
Calibrated meters/submeters, BMS exports, CMMS work orders, refrigerant purchase logs, leak tickets, and certified recovery forms.
Chain of custody
Who collected the data, when, transformations applied, and versioning.
Assurance design
Internal controls (segregation of duties, review/approval), third-party verification scope (reasonable vs. limited), and retention timelines.
Methodologies
Emission factors (source/version), boundaries (Scopes 1/2/3), facility lists, and treatment of estimates vs. measured values.
Change control
Documented adjustments, root-cause analyses, and preventive-action tracking.
Regulatory Milestones (CA / NY / SEC / CSRD)
CA SB 253
CARB regs due by Jul 1, 2025; Scopes 1–2 reports 2026 (on 2025 data); Scope 3 2027 (on 2026 data); assurance phases in.
Source: Ecolytics
CA SB 261
First biennial climate-risk report in 2026 for entities with >$500M revenue.
Source: Stok
NY Part 494
Adopted Jan 2025; registry, reporting, leak detection, and end-of-life requirements phase in (DEC). Source: Department of Environmental Conservation
NY Part 253
Proposed Mar 2025; first reports due Jun 1, 2027 (2026 data); verification required (DEC).
Source: Latham & Watkins
SEC Climate Rule
Adopted Mar 6, 2024; stayed Apr 4, 2024 pending judicial review; earliest compliance for LAFs was FY 2025 (if stay lifts).
Source: DART; Environmental and Energy Brief
CSRD
Phased from FY 2024–2028 depending on company type; ESRS reporting with assurance.
Source: Finance; Plan A

Why California & New York Are Cold-Chain Anchors
And Why Their Rules Reach Everyone
California= production + Pacific gateways
Outsize origin for perishables
California grows over one-third of U.S. vegetables and over three-quarters of U.S. fruits & nuts; dairy is a top-value commodity.
The net effect: a disproportionate share of America’s temperature-controlled flow (produce, dairy, wine) starts in CA and must be cooled, transported, and merchandised under strict temperature control.
Export muscle
The Port of Oakland has ranked #1 in U.S. refrigerated export TEUs for multiple consecutive years—a clear signal that California shapes global handling, monitoring, and documentation norms for cold cargo.
Gateway scale
Los Angeles/Long Beach add massive Pacific capacity for reefer imports/exports and domestic distribution, putting California at the center of West-coast cold-chain flows.
New York= intake + distribution to the densest U.S. market
Importer to a mega-market
The Port of New York & New Jersey brands itself the nation’s leading refrigerated-cargo port, with terminals that collectively provide very high reefer-plug capacity (e.g., sites listed with ~1,200 plugs), enabling huge perishables throughput into the Northeast.
Downstream volume
The Fulton Fish Market (Bronx) moves millions of pounds of seafood daily with ~$1B+/year in sales, feeding restaurants and retailers across the region.
Upstate production
Roughly 2,800 dairy farms produce ~16.1B lbs of milk annually (~7% of U.S. total)—a constant, two-way refrigerated flow across the state.
So what?
California and New York aren’t just regulatory bellwethers (SB 253/SB 261; Part 494/Part 253).
They are where the U.S. cold chain happens at scale: from California’s farm output and Pacific reefer exports to New York’s reefer-import gateway, seafood hub, and dairy engine.
That’s why asset-level leak logs, energy KPIs, and downtime records in these states have outsized ESG and financial relevance across retail, restaurants, and grocery.

CA & NY Will Set the Pace: Nationally and Globally
They are Cold Chain Anchors With Coast-to-Coast Impact
California is where America’s cold chain begins; New York is where it clears the market and sets the terms.
California’s fields, dairies, and wineries push an unmatched volume of perishables into motion, and Pacific ports (Los Angeles/Long Beach, Oakland) turn that volume into global reach.
New York receives and redistributes at scale through the Port of New York & New Jersey into the nation’s densest consumer market, amplified by its seafood hubs and upstate dairies.
Because California shapes how cold cargo is grown, handled, logged, and powered, and New York concentrates the finance, insurance, and retail decisions that price those operational risks, what clears the bar in these two states quickly becomes the baseline everywhere; even for companies not based there.
In short: California feeds the flow; New York sets the terms.
Why do their standards travel?
Market gravity at both ends
CA is a production/export engine; NY is an import/distribution engine.
When one end (CA) and the other end (NY) demand higher standards, everyone in the middle (growers, carriers, 3PLs, warehouses, and retailers in every state) adopts the same SOPs to keep product moving.
“Strictest rule wins.”
Multi-state brands won’t run 50 compliance programs; they standardize to the highest bar.
CA’s SB 253/SB 261 and NY’s Part 494/Part 253 become the de facto baseline for refrigerant management, leak detection, energy data, and climate-risk disclosure.
Vendors follow: once their equipment, records, and telemetry satisfy CA/NY, they roll that template out nationally.
Ports as policy accelerators
CA (Pacific) and NY (Atlantic) gateways are chokepoints.
Terminal rules for reefer safety, temperature verification, and documentation propagate upstream to growers/packers/3PLs and downstream to stores and restaurants.
Carriers won’t maintain two data-capture systems—they standardize fleet-wide.

Capital and insurance amplification
New York’s financial center translates operational KPIs (leak rates, downtime, kWh intensity) into debt pricing, covenants, and coverage.
Once lenders/insurers bake those expectations into portfolios with NY/CA exposure, the same data and assurance standards roll across the country and into cross-border deals.
Not just companies headquartered in CA and NY
If you sell into California or New York, source from suppliers there, route freight through their ports, use carriers/3PLs that serve those markets, or seek financing from NY-based institutions, you’ll feel CA/NY expectations.
Even when a firm isn’t directly obligated to file under SB 253 or NY Part 253, contractual flow-downs (customer data requests, supplier codes), logistics standardization (port/terminal requirements), and financing diligence (ESG-linked terms) export CA/NY standards to Ohio, Texas, Florida; everywhere.
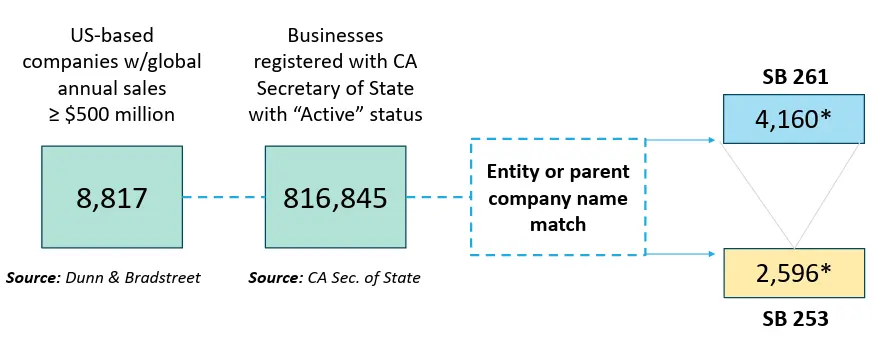
How Many Companies Are Actually in Scope? (CA & NY)
California (SB 253 / SB 261)
Early legislative materials often cited ~5,300 companies for SB 253 and >10,000 for SB 261.
In 2025 CARB workshops, updated modeling pointed to ~2,600 entities under SB 253 and ~4,200 under SB 261 (with a preliminary in-scope list forthcoming).
Statutory thresholds and timing remain: >$1B revenue + “doing business in CA” for SB 253; >$500M revenue for SB 261; first reports begin 2026–2027.
New York (Part 494 / Part 253)
Part 494 (HFC standards & reporting) is adopted and phasing in registration, leak detection/repair, and end-of-life obligations.
Part 253 (Mandatory GHG Reporting) is proposed; first emissions reports due June 1, 2027 for the 2026 data year.
NYSDEC hasn’t published a definitive count, but covered categories (e.g., fuel suppliers, electric power entities, large sources) imply substantial scope.
🚨 Get ahead of refrigerant regulations. Learn how our leak and tagging solutions can help.
Assurance templates and workforce effects
Assurance templates forged here.
CARB (CA) and NYSDEC (NY) shape methods and assurance expectations; NY-based auditors/ratings houses pressure-test the data model. Those templates become blueprints for SEC/CSRD-aligned disclosures and lender diligence everywhere.
Workforce & training.
High-activity markets build deeper technician benches and PM discipline. Those checklists (charge-size thresholds, isolation/repair protocols, evidence retention) become national playbooks for multi-site operators.
In Practice: Milk, Fish, Vegetables, Wine
Milk (NY)
Store/DC leak logs, overtime controls, and kWh per case become the KPI standard procurement writes into national specs.
Fish (NY)
Port-set temperature traceability and outage response become SOP for inland DCs and restaurants.
Vegetables (CA)
Field-to-DC telemetry, faster leak isolation, and verified recovery become standard on other lanes to cut waste and Scope 1.
Wine (CA→NY)
Cellar/DC efficiency (kWh/HL-year) and leak-tight service methods become lender-reviewed KPIs in inventory-backed facilities.

Retail case-in-point: Refrigerants dominate Scope 1
Dollar Tree (FY2022)
~298,564 mtCO₂e fugitive (refrigerant) emissions out of ~421,840 mtCO₂e total Scope 1; ~71% of Scope 1.
Walmart (CY2023)
On-site refrigerants ≈ 55% of Scope 1 (with aging equipment and leak rates called out as drivers).
| GREENHOUSE GAS EMISSIONS (mt CO₂e) | 2020 | 2021 |
|---|---|---|
| SCOPE 1 EMISSIONS | ||
| Mobile combustion | 6,010 | 3,570 |
| Stationary combustion | 79,478 | 92,480 |
| Fugitive emissions | 154,216 | 116,353 |
| Total Scope 1 emissions | 239,704 | 212,403 |
| SCOPE 2 EMISSIONS | ||
| Scope 2 (Location-based method) | 1,132,928 | 930,829 |
| Scope 2 (Market-based method) | 1,111,385 | 1,035,337 |
| Total Scope 1 and 2 emissions (MBM) | 1,351,089 | 1,247,740 |
| SCOPE 3 EMISSIONS (FROM AVAILABLE DATA)⁷ | ||
| Purchased goods and services | 4,644,970 | 5,469,787 |
| Upstream transportation and distribution | 840,191 | 706,312 |
| Business travel | 1,236 | 2,492 |
| Total Scope 3 Emissions | 5,486,397 | 6,178,591 |
Why refrigerants matter so much?
Refrigerant R-22 has a GWP of 1,810. 1 lb R-22 ≈ ~1,810 lbs CO₂e; a 30-lb cylinder released is roughly equivalent to the annual CO₂ from ~7 cars.
Carbon-neutral plans that ignore leak prevention and end-of-life recovery (reclaim/destruction) are incomplete under CA and NY expectations.
CA and NY set the floor and pull the ceiling.
Build programs that can pass SB 253/SB 261 and Part 494/Part 253, and you’re built to compete; nationally and globally.
Even if your headquarters is nowhere near Sacramento or Albany, if your products, partners, ports, or financing run through these states, their rules (and the data discipline behind them) are already on your doorstep.
Environmental credits are recognized as assets on the financial statements when it is probable they will be used to settle an environmental credit obligation or transferred in an exchange transaction.
How SB 253 Can Reach an Ohio Retailer (Even If You “Only” Touch the Port of LA)
Guidance on “How” SB 261: Climate Risk Reporting
- Reports must be posted to the entity’s website by January 1, 2026, and every two years thereafter
- CARB will post a public docket on December 1, 202,5 for entities to post the public link to their reports
- Docket scheduled to close July 1, 2026
- A number of resources exist for guidance on climate-related financial reporting:
- Recommendations of the Task Force on Climate-related Financial Disclosures
- TCFD’s Reporting Climate-Related Financial Information: Critical Introductory Materials
- IFRS S2 Climate-Related Disclosures
- IFRS Comparison of IFRS S2 and TCFD Recommendations
- CARB will provide guidance on minimum requirements for compliance with HSC § 38533
What SB 253 does
California’s SB 253 requires companies doing business in CA with > $1B in total annual revenue to disclose GHG emissions: Scopes 1–2 first, then Scope 3, with assurance phasing in.
(SB 261, the Climate Related Financial Risk Act, requires that by January 1, 2026, and biennially thereafter, U.S.-based entities with more than $500 million in annual revenue doing business in California must make publicly available a report on climate-related financial risks and any measures they have adopted to reduce and adapt to those risks).
The two tests that matter:
- Revenue threshold: worldwide revenue > $1B (prior fiscal year).
- “Doing business in California” (Revenue & Taxation Code § 23101, administered by FTB): you are “doing business” if any of the following is true:
- You actively engage in transactions for financial gain in CA;
- You are organized or commercially domiciled in CA;
- Your California sales, property, or payroll exceed the indexed dollar thresholds or 25% of your total.
Thresholds are indexed annually (e.g., recent years have shown mid-six-figure sales thresholds and mid-five-figure property/payroll thresholds). Always confirm the current-year FTB amounts.
Three common Ohio retailer scenarios
1) You are “doing business” in CA → SB 253 applies.
If you top $1B revenue and meet any §23101 factor: e.g., ship enough to California customers to exceed the sales threshold; have CA payroll (store staff, brand reps, staffed 3PL); or CA property (leased DC space), then you’re a reporting entity.
Prepare for Scopes 1–2 first, then Scope 3, with third-party assurance.
2) You’re not “doing business” in CA → no direct filing, but real indirect impacts.
If you only route containers through LA/LB and have no CA sales, property, or payroll, SB 253 likely doesn’t bind you directly. You’ll still feel it through:
Customer flow-downs
CA customers (who must file) will require Scope 3 data (freight emissions, packaging, upstream energy) from you.
Supplier/logistics requirements
Carriers, 3PLs, ports, and DCs serving CA reporters will standardize on SB 253-grade data capture and push those requirements onto shippers, even in Ohio.
Financing/insurance pressure
Lenders/insurers increasingly tie pricing and covenants to auditable non-financial KPIs (energy intensity, waste, leak controls where relevant), borrowing SB 253/NY standards for diligence.
3) You plan to expand into CA → pre-wire now.
The moment you cross an FTB factor threshold (sales/property/payroll) or otherwise transact for gain in CA, your prior-year revenue governs SB 253 applicability, and disclosure clocks are already set.
Build investor-grade data plumbing now (energy, refrigerants if applicable, freight, waste) and align suppliers to your Scope 3 data model.
Key nuance
Using the Port of LA alone typically does not create a “doing business” nexus.
It’s the sales/property/payroll (or other in-state transactions) that trigger §23101; but if you sell into CA, supply CA customers, or source from CA, expect SB 253-style data, controls, and assurance to reach you via contractual requirements and lender asks, even before you formally cross into “doing business.”
Clean decision aid
Is worldwide revenue > $1B?
- No → No direct SB 253 filing (yet); expect customer/lender data requests.
- Yes → Next question…
Do you meet §23101 “doing business” (sales/property/payroll thresholds or 25% tests; or organized/domiciled; or active CA transactions)?
- No → No direct filing, but anticipate Scope 3 flow-downs and financing diligence.
- Yes → SB 253 applies; prepare Scopes 1–2 first, Scope 3 next, with assurance.
Practical tip for non-CA retailers
Track your factor presence against the current FTB thresholds; map any CA sales, property, payroll, and staffed 3PLs; and build a Scope 3-ready supplier data model (freight, energy, packaging, waste) so you can answer customer and lender requests without scrambling.

Sector Personas (Same KPIs, Different Emphases)
Grocery
Large rack systems, high charge sizes, and many cases.
Focus on leak rate trajectory, downtime minutes, and food-waste %; connect to SB 253 Scope 1 and Part 494 obligations.
Quick-Service Restaurants (QSR)
Many small units, frequent cycling.
Emphasize preventive vs. break-fix ratio, technician overtime, site-level kWh/cover; standardize PM to cut call-outs.
Full-Service Restaurants
Mixed HVAC/refrigeration; wine storage.
Prioritize equipment efficiency (kWh/unit), cold-line reliability, and safety incidents; link to guest experience and margin.
Distribution / Cold Storage
Fewer but larger systems; single points of failure.
Track mean time between failure, leak rate, and contingency power; tie to Part 253 reporting readiness and lender risk views.
→ Read About “Budget Reality: Where the Money Currently Leaks”
ESG Reporting Challenges
Despite the growing importance of ESG reporting, companies face significant challenges in delivering high-quality ESG data.
Collecting, verifying, and managing ESG data across multiple sites and business units can be resource-intensive, especially for organizations with complex operations or global supply chains.
Ensuring that ESG reports are accurate, reliable, and transparent requires robust internal controls and often, third-party assurance.
Navigating the landscape of ESG reporting frameworks adds another layer of complexity.
With multiple reporting frameworks (each with its own requirements and focus areas) companies must determine which standards best fit their business model and stakeholder expectations.
The lack of standardization across ESG reporting frameworks can make it difficult for investors and other stakeholders to compare ESG performance between companies.
Balancing transparency with the need to protect sensitive business information is another ongoing challenge.
Companies must decide how much detail to disclose in their ESG reports while safeguarding proprietary data.
Ultimately, overcoming these challenges is critical for building trust with stakeholders and ensuring that ESG performance is accurately reflected in reporting frameworks.
Kitchen energy, refrigerant emissions, waste, and staff metrics directly impact margins and compliance.
Best Practices in ESG Reporting
To maximize the value of ESG reporting, companies should prioritize transparency, accountability, and consistency.
Effective ESG reports clearly communicate both achievements and areas for improvement, providing stakeholders with a balanced view of ESG performance. Regular reporting (ideally on an annual basis) ensures that ESG data remains current and actionable.
Engaging with stakeholders, including investors, employees, and customers, helps companies align their ESG reporting with stakeholder expectations and material issues.
Incorporating external assurance, such as independent audits or reviews, can further enhance the credibility of ESG reports.
Integrating ESG reporting into the broader reporting framework (such as including ESG disclosures in annual financial reports) demonstrates a commitment to embedding sustainability into core business practices.
Leveraging established ESG reporting frameworks, like the GRI or SASB, ensures that ESG reports are consistent, comparable, and aligned with global best practices.
📌 By following these principles, companies can strengthen their ESG performance and build lasting stakeholder trust.
ESG Reporting Tools and Resources
A range of tools and resources is available to help companies streamline ESG reporting and improve ESG performance.
The Global Reporting Initiative (GRI) and Sustainability Accounting Standards Board (SASB) offer comprehensive reporting frameworks that guide companies in structuring and disclosing ESG data.
ESG reporting software solutions, including data management and analytics platforms, enable organizations to efficiently collect, analyze, and report ESG metrics across their operations.
Consulting services and ESG advisory firms provide expert guidance on navigating reporting frameworks, developing ESG strategies, and ensuring compliance with international financial reporting standards.
Online resources, such as the ESG Reporting Guide, offer practical overviews of reporting frameworks, standards, and best practices for sustainability reporting.
The International Financial Reporting Standards (IFRS) Foundation, through the International Sustainability Standards Board (ISSB), also provides valuable resources and draft standards to support high-quality ESG disclosures.
Additionally, ESG ratings and scores from providers like MSCI and S&P Dow Jones can help companies benchmark their ESG performance and identify opportunities for improvement.
By leveraging these tools and resources, organizations can enhance the quality and impact of their ESG reporting.
📌 By following these principles, companies can strengthen their ESG performance and build lasting stakeholder trust.
Where ESG Reporting is Used
SEC Climate Disclosure (U.S.)
Financial-grade climate data (governance, risk, and metrics) in annual reports—refrigerants and energy front and center for cold-chain sectors. Rule currently stayed pending litigation.
Source: Latham & Watkins
CSRD (Europe)
Annual ESRS-aligned reports with double materiality, cross-site granularity, and assurance.
Source: Finance
California: SB 253 and SB 261
Scopes 1–3 emissions disclosure (SB 253) and biennial climate-risk reporting (SB 261) with timelines beginning 2026; refrigerants and energy are unavoidable data pillars.
Source: Stok
New York: Part 494 and Part 253
HFC standards + reporting + leak detection (Part 494, adopted), and statewide mandatory GHG reporting (Part 253, proposed) with verification and first reports due 2027 (2026 data).
Sources: Department of Environmental Conservation; Latham & Watkins
The Competitive Advantage
ESG done well is not just compliance. It creates measurable advantage: lower financing costs, improved workforce retention, operational savings, and stronger consumer trust.
Risk Management and Risks of Inaccurate or Incomplete ESG Reporting
- California penalties under SB 253
- New York enforcement under Part 494 / Part 253
- Federal exposure under SEC/EPA frameworks
- Reputation damage with investors and customers
- Employee morale declines if commitments aren’t backed by real data
Poor data can trigger fines, raise borrowing costs, and erode stakeholder trust.
Source: JD Supra

Conclusion: ESG as a Cold-Chain Imperative
For retail, grocery, and restaurant operators, ESG is now the operating system for climate and operational risk.
In California and New York (anchors of America’s cold chain), laws bring milk, fish, vegetables, and wine into the same frame as investor disclosures.
With Connex and FutureBuilt, operators can turn site-level data into compliance, resilience, and advantage, keeping the cold chain sustainable from farm to fork, coast to coast.
→ 🎥 Watch! AKO Leak Detector in Action
🚨 AKO & Carbon Connector turn refrigerant leaks into actionable operations intelligence: tracking energy, product risk, and repair status in real time.
Stay in safe water
At AKO & Carbon Connector, we are committed to solving the refrigerant leak problem, relying on AKO’s fixed leak detectors to provide the signal; Carbon Connector ingests those signals, layers them in our asset-tagging registry, and runs a real-time triage/dispatch engine.
In practice, we can monitor hundreds of active alarms and separate noise from actionable events: correlating each alert with charge size, recent top-offs, energy drift, product-at-risk status, store priority, and open SLA/repair clocks.
Only the events that matter become work orders.
We merge duplicates, bundle nearby calls to cut truck miles, and route the right tech with the asset history pre-filled; the legal repair clock starts automatically.
→ Read About “Refrigerant Leak Detection as a Service”
On-site, the technician evaluates the system, not just the alarm (pressures/temperatures, charge integrity, recent service, and load conditions), then scans the tag, fixes the issue, and closes with before-and-after verification (no paperwork chase).
We follow up in real-time to confirm resolution; if it’s a miss, we reopen, escalate, and learn: updating playbooks and sharing insights with the field so the next call is faster and more efficient.
The tagging makes audits and walk-throughs straightforward: we’re looking at the right equipment, against the right requirement, and capturing the right data (leak logs, verification tests, ALD uptime/calibration).
The result?
Alignment to CA SB 253/SB 261 and NY Part 494/Part 253, plus better day-to-day operations; fewer nuisance alarms, fewer emergency rolls, lower energy drag, better labor utilization.
Simple: detect → triage → dispatch → diagnose → verify → coach → disclose—safe, steady, and investor-grade
Notes on compliance precision:
- SB 253/SB 261: thresholds, timelines, and CARB rulemaking milestones as cited.
Source: Ecolytics; Stok - NY Part 494: adopted 2025; includes registry, reporting, leak detection, and end-of-life reclamation.
Source: Department of Environmental Conservation - NY Part 253: proposed 2025; data-collection + verification; first reports proposed June 1, 2027 (2026 data).
Source: Latham & Watkins - SEC: final rule (3/6/24) currently stayed (4/4/24).
Source: Latham & Watkins - CSRD: ESRS, double materiality, phased timeline.
Source: Finance