The Stars Might Lie, But the Numbers Never Do
There’s a post making the rounds on LinkedIn. A monitoring company (one I respect for its ambition) reports that actual HFC leak rates across thousands of systems exceed 30% annually.
The chart is dramatic. The implication is clear: operators are flying blind, and the crisis is worse than anyone thought.
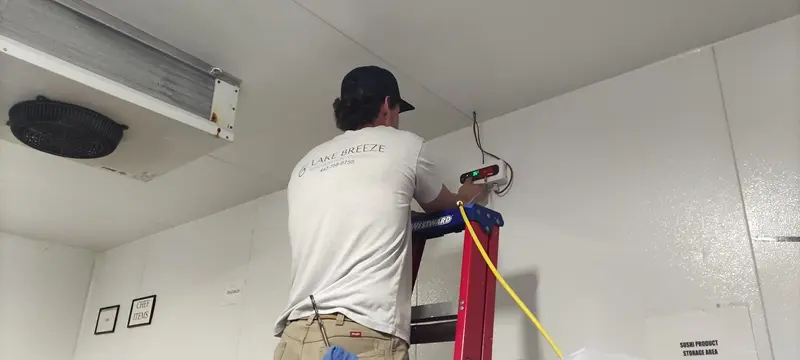
I’ve been in this industry for 32 years. Refrigerant sales. Reclaim operations. Leak detection. Field service. Compliance Infrastructure.
I built one of the largest refrigerant reclaim operations in the world. I still spend time in the field, riding in trucks, walking stores, and talking to technicians. That time informs everything I do behind a screen.
The underlying issue is real. Refrigerant leaks are a genuine environmental and operational problem. The AIM Act ER&R program exists for good reason.
But 34.6%? Let’s do the math first.

The Arithmetic Problem
Let’s build the US refrigerant picture from the ground up, using AHRI data and EPA market estimates that account for all stationary systems: CFCs, HCFCs, HFCs, and HFOs.
The US has approximately 40,000 grocery stores of all sizes. An average store (old school or new school, 2–3 racks) carries roughly 1,500 pounds of refrigerant. That puts the total installed refrigerant charge across the entire US grocery sector at approximately 60 million pounds.
Beyond groceries, the US has approximately 225 million stationary refrigerant-containing appliances — everything from residential mini-splits and RTUs to large commercial chillers. Total installed charge across that entire universe runs approximately 2 billion pounds, averaging roughly 8–9 pounds per unit across the full range of system sizes.
Combined US installed base: approximately 2.06 billion pounds of refrigerant across all stationary systems.

Now apply a 34.6% annual leak rate to that number.
You get 713 million pounds of refrigerant leaking into the atmosphere annually, just to replace what leaked, before accounting for new equipment, retrofits, or system replacements. EPA AIM Act baseline data puts total US HFC consumption in the range of 170–200 million physical pounds per year. The implied replacement demand of 34.6% is off by a factor of 3–4x relative to the entire national supply chain. That refrigerant doesn’t exist. It isn’t being produced. It isn’t being imported. The numbers don’t reconcile.
But let’s get even more specific, because the supply chain argument, while decisive, is abstract. The service record argument is not.
📌 The numbers don’t lie, but they often need a translator. Let’s start a conversation
The Truck That Would Have to Show Up
At a 34.6% annual leak rate on a 1,500-pound grocery store system, you are losing roughly 520 pounds of refrigerant per year.
Refrigerant isn’t added continuously. It’s added reactively: when a low-pressure alarm triggers and a technician responds.
In practice, that means additions happen in 80–100 pound increments, which is the typical threshold at which an alarm fires and a service call is warranted.
Do the math: 520 pounds per year, added in 80–100 pound increments, means a refrigerant truck is visiting that store 5–6 times a year just for top-offs. Not for repairs. Not for scheduled maintenance.
Just to keep the system from alarming out.
A refrigerant service truck showing up at your loading dock every 6–8 weeks is not invisible. It shows up on invoices. It shows up in maintenance logs.
It generates conversations between the store manager, the facilities team, and the service contractor.
In my experience, a store manager watching that pattern for even one quarter is going to be all over the service contractor, demanding a repair, not a top-off.
I’ve been exposed to tens of thousands of grocery locations across this industry. In my direct experience, approximately 20% of stores have a leak rate greater than 20% annually.
That’s meaningful; those are real leaks, real losses, real compliance exposure, and they deserve serious attention. But it also means 80% of stores are running well below 20%.
The blended portfolio average across all locations doesn’t approach 34.6%.
It lands somewhere in the 8–12% range, which, not coincidentally, is exactly where our own investigations have consistently arrived when we’ve dug into alarming numbers and cross-referenced them against service records.

I once had a client reporting approximately 40% leak rates across a portion of their portfolio.
We investigated. We checked the sensor data against refrigerant purchasing records and service logs.
The actual rate was closer to 12%. Less than a third of what the monitoring data suggested. The leaks were real.
The magnitude was not.
The Data Can Be Wrong Before the Sensor Even Fires
Sensor accuracy gets most of the attention in leak detection debates.
But there is an entire category of data corruption that happens upstream of any sensor; in the way refrigerant consumption gets recorded, invoiced, and reported in the first place.
In my experience, it is every bit as consequential.
Years ago, a convenience store chain came to us reporting leak rates that included some individual locations showing 125% annual charge replacement. Not 34.6%. Not 40%.
One hundred and twenty-five percent, meaning technicians were allegedly adding more refrigerant in a year than the entire system held. That number is physically impossible if you think about it for thirty seconds.
You cannot leak more than 100% of your charge in a year. The moment you hit 100%, you have no refrigerant left, and the system is down.
So we investigated. We found two distinct problems, both invisible to any monitoring platform.
Phantom emissions from bottle heel accounting
When a technician adds refrigerant from a cylinder, the first portion charges quickly. The second and third portions charge more slowly as pressure equalizes.
The last 15–20% of most cylinders (the heel) often doesn’t transfer at all under field conditions. But the service ticket frequently records the entire cylinder as added to the system.
That refrigerant never entered the system. It stayed in the bottle, went back on the truck, and got returned or reused.
But on paper, it was logged as a system charge, which means it showed up as refrigerant consumption, which means it inflated the apparent leak rate.
We called these phantom emissions. It is not fraud. 👻
It is sloppy field accounting that is completely standard practice across the industry, and it systematically overstates leak rates at every location where it occurs.
Misappropriated refrigerant
The second finding was harder. After tagging cylinders and auditing the chain carefully, we found refrigerant that had been invoiced to specific store accounts but never made it into those systems.
Some of it showed up on Craigslist, an organized diversion of refrigerant charged to a commercial account and resold.
But the more common pattern, and the more systemic one, is simpler: a technician charges refrigerant to a store account and uses it on a side job. The store gets billed. The store’s leak rate goes up.
The refrigerant is somewhere else entirely. This is not a monitoring problem. It is not a sensor problem.
It is a chain of custody problem, and no amount of continuous monitoring will catch it, because the corruption happens in the invoice, not in the system.
When we completed the investigation and cleaned the data (correcting for heel accounting, removing misappropriated charges, reconciling service records against actual system readings), the chain-wide leak rate came in at 15–20%.
Not 125%. Not 40%. Fifteen to twenty percent, which is meaningful and worth addressing, but a completely different operational and compliance picture than the raw consumption data suggested.
The lesson is not that leak rates are low or that the industry has nothing to worry about.
The lesson is that refrigerant consumption data is not the same as leak rate data, and treating it as such, without auditing the inputs, produces numbers that are wrong in ways that monitoring technology alone cannot fix.
The Sensor Isn’t Wrong: The Interpretation Is
I wear a smartwatch. Good one. When I’m on a job site (hammering, running heavy tools, doing real physical work), my watch asks me if I just fell.
The accelerometer interprets the impact vibration as a fall event. It’s not wrong about the vibration. It’s wrong about what the vibration means.
That’s precisely what’s happening in a significant portion of refrigerant monitoring deployments. The sensor isn’t broken in the traditional sense. It’s detecting something.
But the interpretation of that detection is where the mischief lives, and the gap between a sensor reading and a confirmed leak is wider than most monitoring narratives acknowledge.
Here’s what actually drives false positives and inflated readings in refrigerant leak detection:
Leak size relative to system size: not an absolute quantity.
This is the most fundamental error in how leaked data gets reported. A 1-pound leak from a 2-pound system is a 50% leak rate.
That same 1-pound leak from a 1,000-pound system is 0.1%. Same leak.
Completely different story. Portfolio-level reporting that averages across system sizes without normalizing for charge weight is comparing apples to freight trains.
The number that comes out the other end is not a leak rate; it’s a weighted average of incompatible inputs.
📌 The right data starts with the right refrigerant leak detectors.
Sensor placement and the volume of monitored space.
Physical leak detection sensors don’t measure pounds lost: they measure parts per million (ppm) concentration of refrigerant in the air around them.
The same ppm reading in a 10-cubic-foot sensor zone represents a fundamentally different quantity of refrigerant than the same ppm reading in a 1,000-cubic-foot machine room.
Proper leak detection methodology accounts for the volume of monitored space when calculating actual emissions — because ignoring it produces leak rate numbers that are as much a function of room size as they are of actual refrigerant loss.
Sensors placed too high, too far from the leak source, in high-airflow zones, or near floor drains compound this further; they catch phantom readings and miss real ones simultaneously.
Calibration to the wrong refrigerant and density is why it matters.
A sensor calibrated for one refrigerant reading a system that has been retrofitted to another will produce systematically misleading results.
Consider the progression that most supermarket systems have been through over the past 30 years: R-22 has a liquid density of approximately 74–75 lb/ft³.
R-404A, which replaced it, runs around 65.5 lb/ft³. R-448A, now the dominant retrofit replacement for R-404A under the AIM Act phasedown, comes in at roughly 62–63 lb/ft³.
That is a 12–15% density spread across three refrigerant generations.
A sensor that was never recalibrated through those retrofits is operating on wrong physics, and that error flows directly into reported charge loss, and from there into reported leak rates.
Sensor age and drift
Most electrochemical sensors drift meaningfully after 2–3 years of service. A sensor that was accurate at installation may be reading 30–40% high by year four.
No alarm announces this. No dashboard flags it. It drifts silently, and every reading it produces is quietly wrong.
Oil contamination
Compressor oil mist in machine rooms is a persistent interferent. It coats sensor elements over time and degrades accuracy in ways that are invisible without deliberate calibration verification.
Temperature and humidity variance
Sensor response curves shift with ambient conditions. A reading from a 95°F machine room in August is not directly comparable to the same sensor in the same location in February.
This isn’t a theoretical concern.
Front-line experience deploying and evaluating leak detection systems has led me to a number that I found uncomfortable enough to force a fundamental rethink of how monitoring data should be weighted: real-world sensor accuracy in typical deployments (accounting for placement, calibration state, age, and environment) runs closer to 65%. Not 100%. Sixty-five percent.
When you build a portfolio-level narrative on the assumption that sensors are gospel, and the actual sensor accuracy under field conditions is 65%, you don’t have a leak rate problem. You have a measurement problem.
The Human in the Loop Is Not Optional
The AIM Act ER&R program is not wrong to demand better leak detection.
Mandatory continuous monitoring, faster repair timelines, and tighter recordkeeping are the right directions.
The industry has coasted too long on quarterly walk-through inspections that catch obvious leaks while missing the slow, chronic ones that erode system efficiency and refrigerant inventory month after month.
But the response to that failure cannot be to replace one form of overconfidence with another.
The scientific process requires more than a sensor and a chart. It requires:
Baseline validation
What was the charge condition of these systems before monitoring began?
A system running chronically undercharged for years before a sensor was installed will look like it leaked the moment you establish a baseline.
The baseline itself needs to be validated, not assumed.
Cross-referencing service records
If sensor data says a system lost 500 pounds of refrigerant last quarter, the refrigerant purchasing and service records should show a corresponding addition.
If they don’t, the data is wrong.
This is the simplest integrity check in the world, and it is remarkable how often it gets skipped in favor of publishing sensor output directly.
Trend analysis over time
A single trailing twelve-month snapshot across a portfolio is a starting point, not a conclusion. Leak behavior has seasonality, correlation with system age and maintenance history, and variance by equipment type and installation vintage.
One year of data from one portfolio is a hypothesis. It deserves to be treated like one.
Talking to the technicians
The service techs who work these systems know things that no sensor will ever capture. They know which systems run chronically low. They know which machine rooms have airflow problems.
They know which sensors were replaced last year and which ones have been in place since the Obama administration.
The handshake between monitoring data and field knowledge is not a nice-to-have. It is the methodology.
This is a conversation, not a soapbox.

Not All Refrigerant Leaks Are the Same
Here’s something the alarming headline misses entirely: refrigerant leak profile matters.
A catastrophic acute leak (a failed valve, a cracked fitting, a service error) looks completely different in monitoring data than a chronic slow leak from a corroded evaporator coil.
Both register as refrigerant loss. Neither should be responded to the same way.
The goal of leak detection is not to generate alerts.
The goal is to identify the nature of the leak so you can dispatch the right technician, order the right parts, set the right urgency, and execute the right repair. Reporting activity is not the same as finding leaks.
A dashboard full of unqualified alerts that a service team cannot effectively triage is not a compliance infrastructure. It’s noise: expensive, distracting noise that erodes trust in the monitoring system itself.
Fault Detection and Diagnostics done right (with multiple data inputs, profile matching, calibrated sensors in validated placements, and human-verified thresholds) is the architecture that makes leak detection meaningful and actionable.
Not a single sensor reading. Not a portfolio average. Not a bar chart.
What Good Looks Like
The awareness that refrigerant leak rates may be higher than historically assumed is not wrong. The underlying concern is legitimate.
The push toward continuous monitoring is directionally correct.
The industry does have a leak problem, and that problem has real environmental and operational consequences.
But good leak detection looks like this:
Multiple inputs, triangulated
Pressure trends, temperature differentials, refrigerant consumption records, service history, and sensor readings; cross-referenced against each other, not treated in isolation.
Calibrated sensors in validated placement positions
Installed with deliberate placement logic. Recalibrated on a schedule. Matched to the actual refrigerant in the system. Replaced when they age past their accuracy window.
Profile-based detection
Distinguish the acute from the chronic. Match the response protocol to the leak type. Not every alert is an emergency. Not every emergency looks like an alert.
Human verification before escalation
No automated reading should drive a compliance conclusion without a trained eye reviewing the data in context. The sensor is the first word. It should never be the last.
📌 Choose to detect refrigerant leaks early. Choose responsibility.
Trend analysis, not snapshots
One quarter of data tells you something. Three years of data (cross-referenced with service records and refrigerant purchasing) tells you the truth.
Service record reconciliation as a standard practice
If your sensor data and your refrigerant invoices don’t agree, the discrepancy is the finding. Start there.
The stars might lie. The numbers never do: as long as you’re working with the right numbers.
34.6% is a number.
Whether it’s the right number is a different question entirely. And that question deserves more than a bar chart.
It deserves the scientific process. It deserves service records. It deserves field experience. It deserves a conversation with the people turning the wrenches.